Blue-Green
Primary visual colorWhere Is Lake Erie?
Ontario; Michigan; Ohio; Pennsylvania; New York · Canada / United States
Drag or zoom the real map. Verified shoreline geometry is highlighted with the lake’s LakeColors palette color when available.
Lake Erie on the Globe
Rotate the world or focus directly on the lake.
Late-October 2026 Bloom Observation
NOAA documented a cyanobacteria bloom off the Michigan coast from north of Maumee Bay to Stony Point, with another low-to-medium concentration patch east of the Lake Erie Islands extending into the central basin. The area estimate applies to this October observation and is not a final 2026 seasonal measurement. NOAA satellite monitoring and forecast products continued into November.
The Strongest Color Contrast Is West-to-East
This shallow basin receives strong river and nutrient inputs and is the main zone for recurring summer cyanobacteria blooms and high turbidity.
These basins are generally less bloom-dominated than the west, although wind, sediment, whiting and transported bloom patches can still alter the surface appearance.
Lake Erie Color Through the Year
Why the Western Basin Turns Green
Wind and Runoff Can Turn the Lake Tan or Milky
Because Lake Erie is shallow, strong winds can stir bottom material into the water column. NASA imagery has documented pale tan, milky green and light-blue sediment-rich swirls, especially in the western lake and along shorelines.
Whiting Can Produce Bright Turquoise Water
Whiting is a carbonate precipitation event rather than a cyanobacteria bloom. NASA describes fine calcium carbonate particles producing pale or turquoise swirls visible from space. Great Lakes research recorded recurring whiting in Lake Erie during 1972–1975, while Lake Huron lacked regular events during the same survey period.
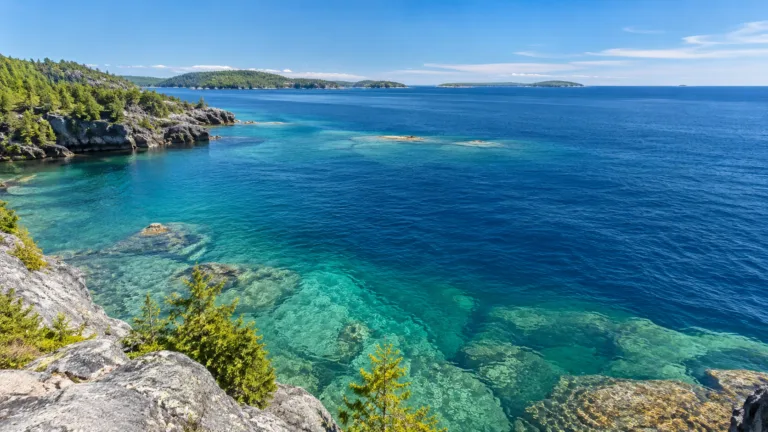
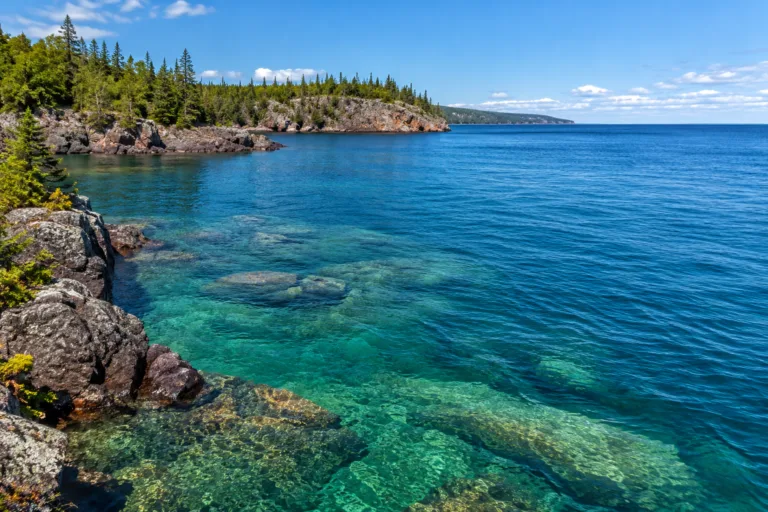
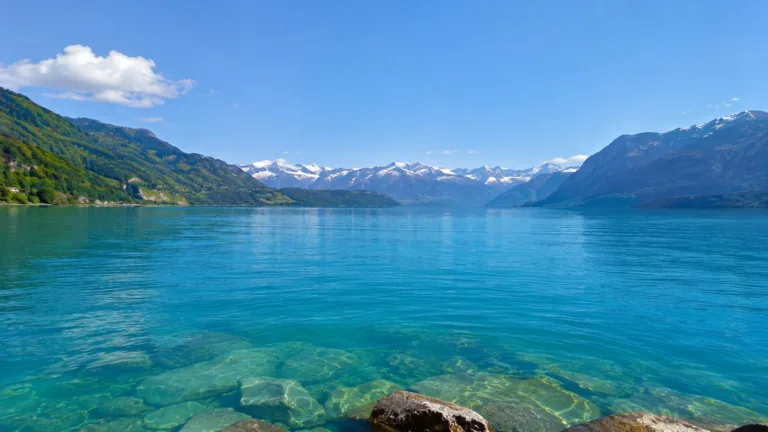
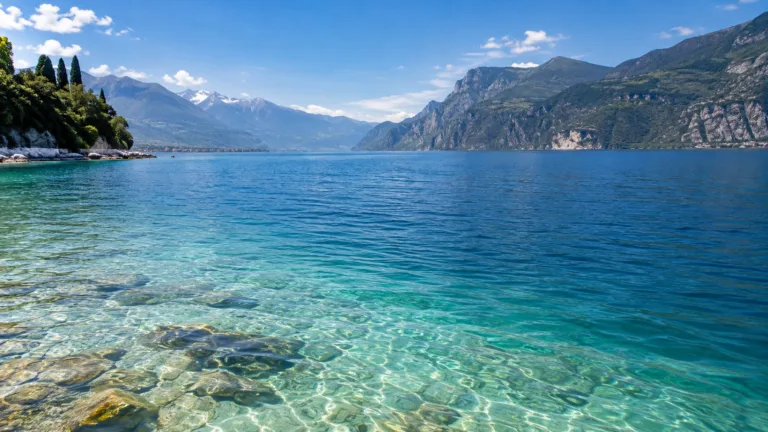
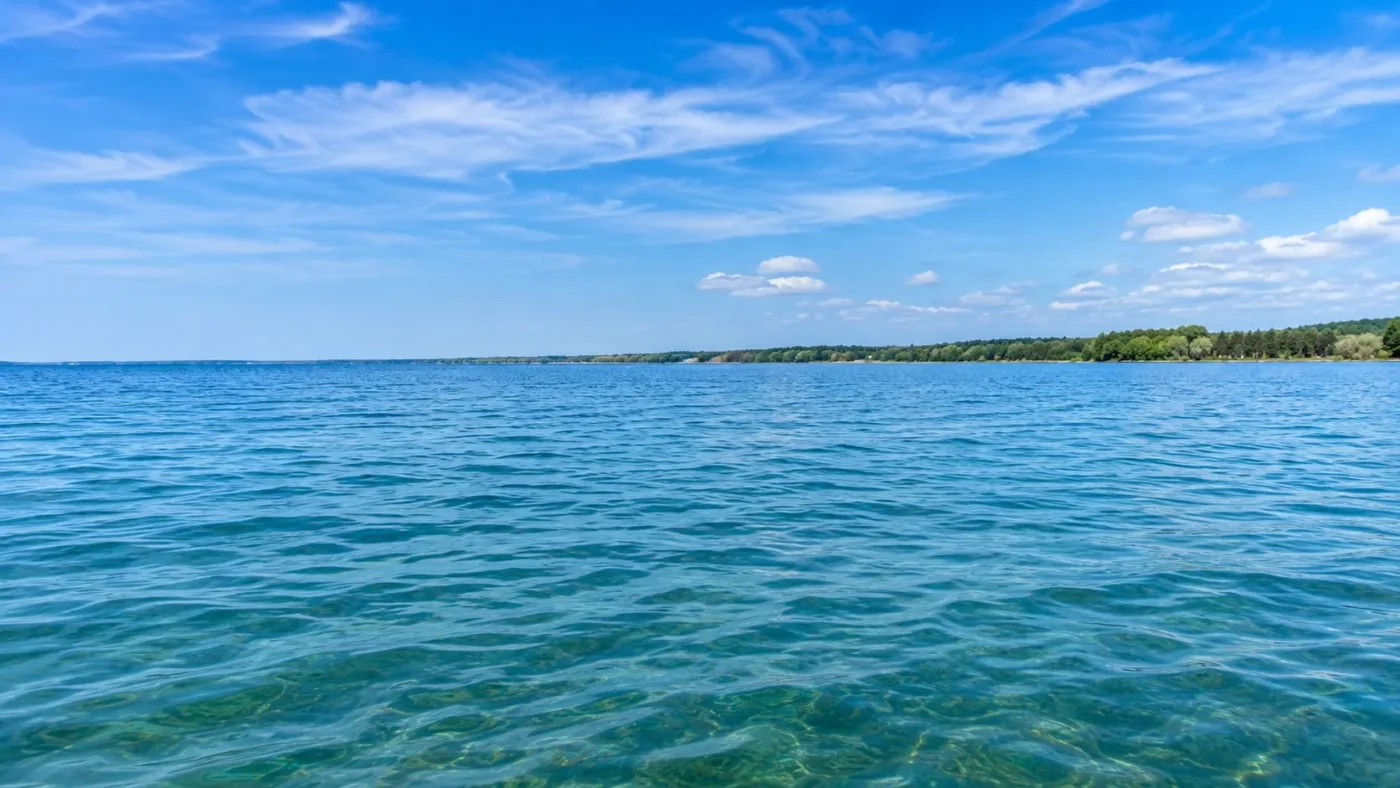
Lake Erie is usually seen as blue-green, but its surface can shift to green, pale tan, milky blue, white, or bright turquoise when biology, sediment, and calcium carbonate change how light leaves the water. The strongest biological color shift is concentrated in the shallow western basin, where recurring Microcystis blooms can turn broad areas green during the warm season.
Lake Erie Has More Than One Real Color Mechanism
Lake Erie’s changing appearance is not just a matter of sunlight or camera settings. Satellite observations have repeatedly captured color produced by different materials in the water: phytoplankton and cyanobacteria add green tones, wind and runoff suspend mineral sediment, and whiting events create pale blue to turquoise water from fine calcium carbonate particles. These processes can occur in different parts of the lake at the same time.
The lake’s shallow western end is especially responsive to wind, river inflow, and biological growth. That makes Lake Erie a poor candidate for a single permanent color label. “Blue-green” works as a broad visual baseline, while the most informative color states are regional and event-driven.
Green water can indicate a cyanobacteria bloom, but color alone does not establish toxin concentration. Likewise, pale blue or turquoise water can come from suspended minerals rather than unusually clear water. NOAA combines satellite detection with models and field observations because appearance, biomass, depth, mixing, and toxicity are separate measurements.
The Greenest Shifts Are Concentrated in the Shallow West
Western Lake Erie receives strong nutrient inputs, with the Maumee River watershed playing a central role in the phosphorus supply that supports recurring cyanobacteria blooms. EPA data characterize the western basin as highly eutrophic, while phosphorus and chlorophyll conditions in the central and eastern basins are more stable and closer to desired ranges.
That water-quality difference becomes a visible color difference during bloom season. NOAA typically operates its Lake Erie cyanobacteria forecast from July through October, tracking bloom location and surface concentration as winds and currents move the biomass. The color boundary is therefore not fixed to a shoreline or basin line; green patches can spread, break apart, sink below the surface, or move eastward.
The 2026 season illustrates that mobility. NOAA’s 30 October 2026 update, based on 28 October satellite imagery, estimated a cyanobacteria bloom covering approximately 240 square miles (622 km²) in western Lake Erie. The main bloom extended along the Michigan coast from north of Maumee Bay toward Stony Point, while a separate low-to-medium concentration patch was observed east of the Lake Erie Islands and into the central basin.
That estimate describes the bloom’s extent on a particular satellite observation date. It is not a measurement of the entire 2026 season, the final extent of the bloom, or the area affected by toxins.
Late-Season Monitoring Continued into November 2026
NOAA’s satellite and forecast records continued beyond the October observation. Its Sentinel-3 imagery and bloom-position forecasts included 9 November 2026, with subsequent NOAA satellite-monitoring products updated through 17 November 2026. The monitoring information continued to indicate cyanobacteria in the western basin, although cloud cover and wind conditions sometimes prevented a reliable estimate of bloom area.
Separately, Ontario’s Union Water Supply System announced in November 2026 that its 2026 seasonal harmful algal bloom forecast updates had ended, with further seasonal updates expected in spring 2027. That announcement marks the end of the utility’s seasonal information service. It does not establish that all cyanobacteria had disappeared from Lake Erie on the announcement date.
Late-season satellite detections and the completion of a seasonal forecast service are different observations. The October estimate remains a documented example of bloom extent, while the November records establish that monitoring continued later in the year. Neither provides a permanent color classification for the western basin.
Storms Can Turn Shallow Water Tan, Milky Green, or Light Blue
Lake Erie is the shallowest Great Lake, so strong winds can lift bottom sediment into the water column with unusual efficiency. Runoff adds another source of suspended material. NASA satellite imagery from February 2024 showed muddy, sediment-laden swirls across much of the lake, with pale tan, milky green, and light-blue tones attributed largely to suspended sediment.
This matters because a greenish satellite image is not automatically evidence of an algal event. Sediment can brighten or mute the water, create broad plumes near shore, and mix with biological color. Wind-driven resuspension is especially important in the western lake, where shallow depth makes the bottom easier to disturb.
Bright Turquoise Can Be a Whiting Event Rather Than a Bloom
One of Lake Erie’s less intuitive color states is bright turquoise or chalky blue. NASA describes whiting as a water-chemistry event in which fine calcium carbonate particles form just below the surface. Those particles scatter light strongly enough to create pale swirls that can be visible from orbit.
Whiting and cyanobacteria can both produce conspicuous warm-season color, but they are different processes. A turquoise patch is therefore not a reliable shorthand for exceptional clarity, and a pale blue-white area is not automatically a reflection artifact. In Lake Erie, mineral particles can be part of the visible water color itself.
Historical Great Lakes research also shows that whiting does not occur equally across neighboring lakes. Strong and Eadie’s 1978 study examined calcium-carbonate precipitation using satellite observations from 1972–1975. During that period, regular summer and autumn whiting was documented in Lakes Erie, Michigan, and Ontario, but not in Huron or Superior.
That difference provides a useful comparison with Lake Huron’s intermittent whiting events. Later satellite studies have identified evidence of changing whiting activity in Huron, yet its historical record remains less consistent than Erie’s. The same carbonate precipitation mechanism can occur in Great Lakes waters without producing an identical frequency or distribution of pale-water events.
Neither whiting nor sediment resuspension should be identified from a bright turquoise color alone. The surrounding water conditions, particle composition, and observations over time are needed to distinguish them.
Seasonal Color Is Strongest as a Pattern, Not a Monthly Paint Chart
Lake Erie has a usable annual color pattern, but not a scientifically measured “one color for every month” cycle. NASA notes that phytoplankton commonly begin flourishing as the water warms in June and July, with algae tending to peak in August and September. NOAA’s operational cyanobacteria season generally spans July through October.
The 2026 observations show that detectable cyanobacteria can persist beyond that usual period. November monitoring should therefore be understood as a possible late-season extension, not evidence that November is consistently a green-water month across Lake Erie. Bloom intensity, spatial coverage, water temperature, and wind-driven mixing differ between years.
Outside the main warm-season window, sediment events, whiting, ice, runoff, and ordinary open-water conditions can alter the lake without producing a repeatable lakewide color for a specific calendar month. A late bloom observation is specific to its date and location, while the broader annual pattern reflects recurring seasonal conditions.
Sources
- NOAA NCCOS — Lake Erie Harmful Algal Bloom Forecast and 2026 Bulletins
- NASA Earth Observatory — Spring Colors in Lake Erie
- NASA MODIS — Sediment Swirls in Lake Erie
- US EPA — Lake Erie Water Quality Data
- NASA Earth Observatory — Whiting of Lake Erie
- Wikidata — Lake Erie Geographic Record
- NOAA NCCOS — Cyanobacteria Algal Bloom from Satellite in Western Lake Erie, November 2026 Monitoring
- Union Water Supply System — Lake Erie Harmful Algae Bloom Forecast, November 2026 Season Update
- Strong and Eadie (1978) — Satellite Observations of Calcium Carbonate Precipitations in the Great Lakes, Limnology and Oceanography