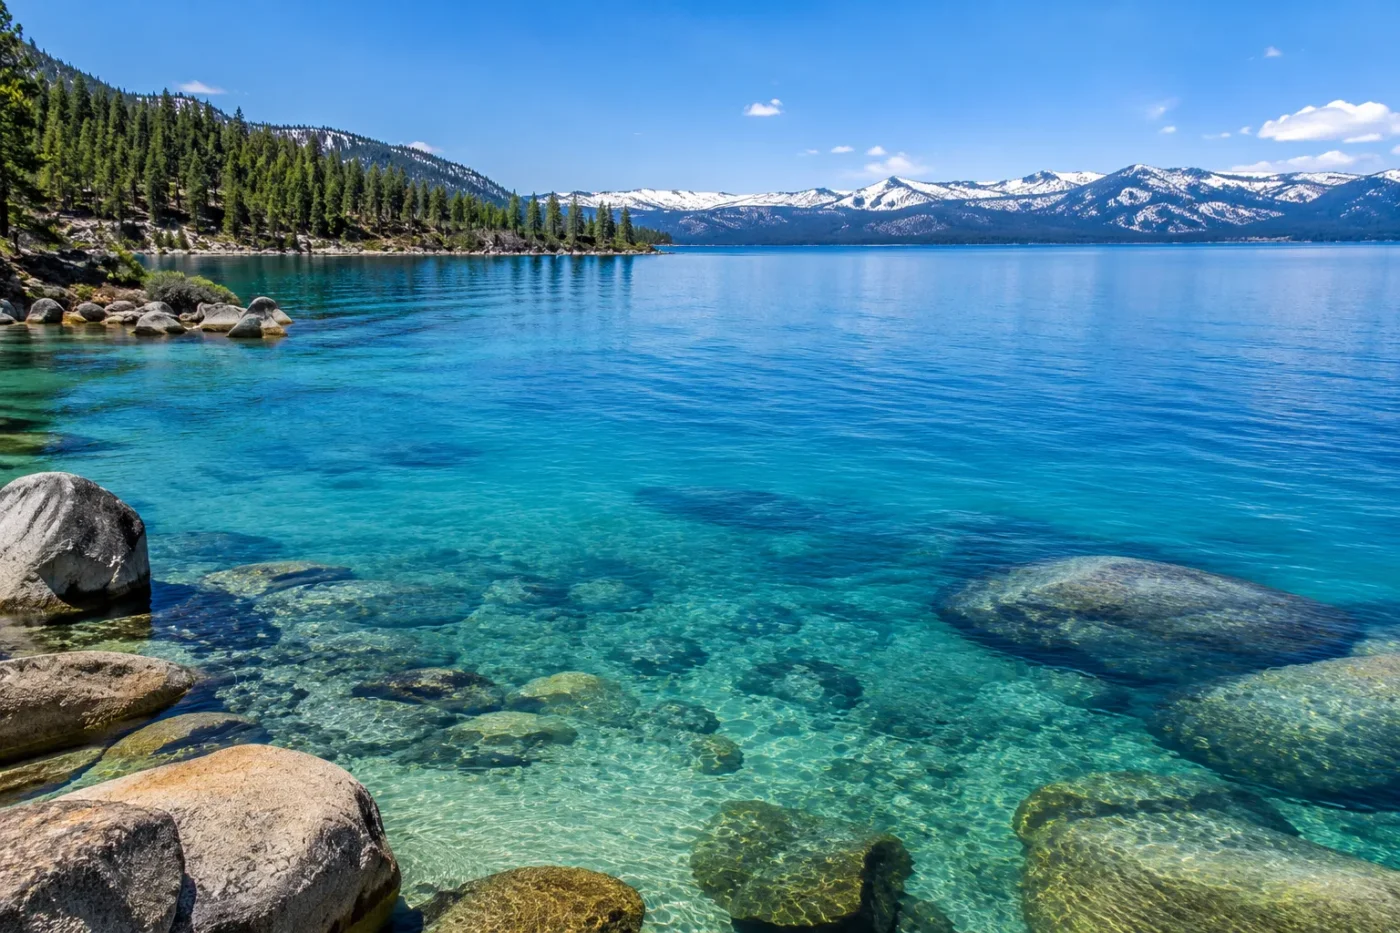
Cobalt Blue
Primary visual colorWhere Is Lake Tahoe?
California–Nevada · United States
Drag or zoom the real map. Verified shoreline geometry is highlighted with the lake’s LakeColors palette color when available.
Lake Tahoe on the Globe
Rotate the world or focus directly on the lake.
What the Hyperspectral Blueness Study Found
2012–2014 monitoringSpectral reflectance measurements were converted into a quantitative Blue Water Index, allowing Lake Tahoe's perceived blueness to be compared with phytoplankton concentration and Secchi clarity.
Finding: Blueness was strongly inversely related to phytoplankton concentration measured with chlorophyll-a fluorescence.
Provenance: Peer Reviewed
Evidence: High
Finding: Blue Water Index values were highest in summer.
Provenance: Peer Reviewed
Evidence: High
Finding: Blueness was not significantly correlated with Secchi depth in the study.
Provenance: Peer Reviewed
Evidence: High
Tahoe Blue Through the Year
How Algae Modulates Tahoe's Blue Signal
Blueness and Clarity Are Related to Different Optical Signals
Signal: Blueness
Measure: Hyperspectral reflectance converted to Blue Water Index
Main Finding: Strong inverse relationship with phytoplankton concentration
Evidence: High
Signal: Clarity
Measure: Secchi disk visibility depth
Main Finding: No significant correlation with Blue Water Index in the blueness study
Evidence: High
Signal: Current Clarity Research
Measure: Particle and biological monitoring
Main Finding: Microscopic algae, picoplankton and Cyclotella are being investigated as contributors to summer clarity
Evidence: Moderate
Lake Tahoe’s signature offshore color is a deep cobalt blue, but the strongest measured control on that blueness is not simply how far a person can see into the water. Hyperspectral monitoring found that Tahoe became bluer as open-water phytoplankton concentrations fell, while the lake’s Secchi clarity could move differently. In other words, algae modulate the intensity of Tahoe blue, and “blue” and “clear” describe two related but distinct optical properties.
Tahoe’s Cobalt Blue Is Not Just Another Word for Clear Water
Lake Tahoe is an ultra-oligotrophic lake with exceptionally low biological productivity compared with nutrient-rich lakes, and UC Davis researchers describe its open water as deep cobalt blue. To move beyond a visual description, researchers from UC Davis, NASA’s Jet Propulsion Laboratory and Université Laval developed a quantitative Blue Water Index, or Bw, from hyperspectral measurements of light leaving the lake.
The resulting study compared color with two very different measurements: phytoplankton concentration, estimated with in-water chlorophyll-a fluorescence, and Secchi depth, the traditional measure of water transparency. The Blue Water Index showed a strong inverse relationship with phytoplankton concentration, but it did not show a significant relationship with Secchi depth. That is the core reason Lake Tahoe can become more intensely blue without becoming clearer at the same time.
The blueness study quantified spectral color rather than assigning an RGB, HEX code or a single dominant wavelength to Lake Tahoe. “Cobalt blue” is a supported visual description; it should not be treated as an exact digital color measurement.
Less Phytoplankton Strengthens the Blue Signal
Algae do not “paint” Lake Tahoe blue. Instead, the amount of microscopic phytoplankton suspended in the open water changes the optical character of the water column. When phytoplankton concentration rises, algal cells and pigments alter the spectrum of light that is absorbed, scattered and returned toward the surface. In the Tahoe measurements, that shift corresponded to a lower Blue Water Index. When phytoplankton concentration was lower, the blue signal was stronger.
Nutrients are an important upstream control because nitrogen and phosphorus can support phytoplankton growth. This is why nutrient management matters to color as well as ecosystem health: changing nutrient availability can change algal abundance, which in turn can alter the intensity of the lake’s blue appearance.
The color study concerns microscopic phytoplankton in the water column. Visible attached algae along rocks and shorelines are a different biological phenomenon and should not be used as a direct visual proxy for the offshore Blue Water Index.
Summer Produced the Highest Measured Blueness
The hyperspectral record used in the published study showed that Blue Water Index values were highest in summer. The seasonal pattern reflects more than sunlight alone. Lake Tahoe’s physical structure changes through the year as mixing, stratification, upwelling and nutrient movement alter the conditions in which phytoplankton grow.
UC Davis describes spring upwelling as common from late May through mid-June, when wind can lift deeper, nutrient-rich water toward the surface while the lake is still weakly stratified. Before roughly mid-May, the lake is typically more vertically mixed; by late June, stronger stratification makes these upwelling events less common until fall storms return around October. Those physical transitions help explain why a single photograph or a single month cannot represent Tahoe’s color behavior for the entire year.
The Color Year maps the peer-reviewed finding of highest summer blueness to June–August as a derived calendar window. It does not claim that every summer day has the same color or that exact month-by-month Blue Water Index measurements are available for the full year.
Blueness and Clarity Can Move in Opposite Directions
Lake Tahoe’s famous transparency is measured with a Secchi disk, while its blueness study used hyperspectral reflectance. Because the measurements respond to different parts of the lake’s optical environment, they should not be treated as interchangeable.
| Signal | How It Is Measured | What the Tahoe Research Shows |
|---|---|---|
| Blueness | Hyperspectral reflectance summarized as Blue Water Index | Strong inverse relationship with phytoplankton concentration; highest values occurred in summer. |
| Clarity | Depth at which a white Secchi disk remains visible | No significant correlation with Blue Water Index in the published blueness study. |
| Current clarity research | Secchi observations plus particle and biological monitoring | Microscopic algae, picoplankton and small diatoms are now being investigated as contributors to reduced summer clarity. |
This last point matters because the older shorthand—“sediment controls clarity, algae controls blueness”—is useful but incomplete. The 2026 State of the Lake reporting notes that unusually high concentrations of tiny suspended particles were observed during summer 2025 and that microscopic algae, picoplankton and the small diatom Cyclotella may play a larger role in clarity than previously understood. The distinction between color and clarity remains valid, but modern monitoring is showing that biology can influence both.
The Original Color Result Is Strong, but It Has a Defined Time Window
The direct relationship between Tahoe blueness and phytoplankton comes from optical monitoring conducted from 2012 through 2014 and published in 2016. That study provides strong evidence for the inverse algae–blueness relationship and the summer maximum in Blue Water Index, but it should not be presented as a continuous color measurement through 2026 unless newer comparable Bw data are available.
More recent Lake Tahoe monitoring adds important context rather than replacing that result. UC Davis continues to track clarity, nutrients, particles and biological communities, and the 2026 State of the Lake report places new emphasis on the smallest suspended organisms and particles. For LakeColors, the most defensible interpretation is therefore two-layered: the cobalt-blue identity and algae–blueness relationship are directly supported by hyperspectral research, while the current state of algae, particles and clarity remains an active monitoring question.
Sources
- UC Davis Tahoe Environmental Research Center — Measuring Blueness
- Watanabe et al. — A Quantitative Blueness Index for Oligotrophic Waters
- UC Davis Tahoe Environmental Research Center — State of the Lake 2026
- UC Davis Tahoe Environmental Research Center — Upwelling
- U.S. Geological Survey — Lake Tahoe Mid-Lake Monitoring Location
- Wikidata — Lake Tahoe Geographic Record