Blue-Green
Primary visual colorWhere Is Lake Taupō / Taupōmoana?
Waikato, North Island · New Zealand
Drag or zoom the real map. Verified shoreline geometry is highlighted with the lake’s LakeColors palette color when available.
Lake Taupō / Taupōmoana on the Globe
Rotate the world or focus directly on the lake.
Deep Caldera, Clear-Water Optics
Lake Taupō's volcanic origin explains its deep basin, but NIWA optical measurements did not identify suspended mineral particles as the main source of its blue-green appearance. In deep clear water, orange-red wavelengths are removed rapidly while blue-green light penetrates farther.
Value: About 94 m
Provenance: Peer Reviewed
Evidence: High
Value: About 160 m
Provenance: Peer Reviewed
Evidence: High
Value: Very small contribution during TAUPEX
Provenance: Measured
Evidence: High
Color Through the Year
Why the Water Reads Blue-Green
Taupō's Measured Optical Properties
Documented measurement dataSpectral reflectance peak; not an RGB or HEX color value.
About 26 m in bays and almost 45 m in the lake center.
The lake center was the clearest during the experiment.
Evidence Behind Taupō's Blue-Green Profile
Claim-level supportField optical work measured the wavelength distribution of reflected and transmitted light across Lake Taupō.
Earth Sciences New Zealand / NIWA — Lake Taupo: clean and blue-greenWater Resources Research — Spectral optical properties of Lake TaupoEvidence: HighLong-term regional monitoring uses Secchi depth, chlorophyll, nutrients and oxygen at the representative deep-water site.
Waikato Regional Council — Lake Taupō water qualityEvidence: HighRecent lake-process research describes winter mixing, summer stratification and the typical August phytoplankton maximum.
Ecosystems — Hypolimnetic nutrient subsidies in Lake TaupōEvidence: HighThe map focus uses a Department of Conservation lake coordinate; the shoreline overlay uses the cross-checked OpenStreetMap relation listed for Lake Taupō.
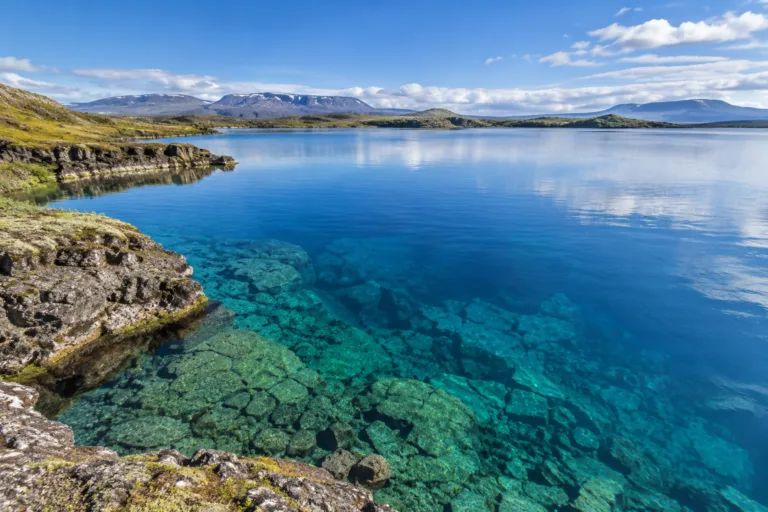
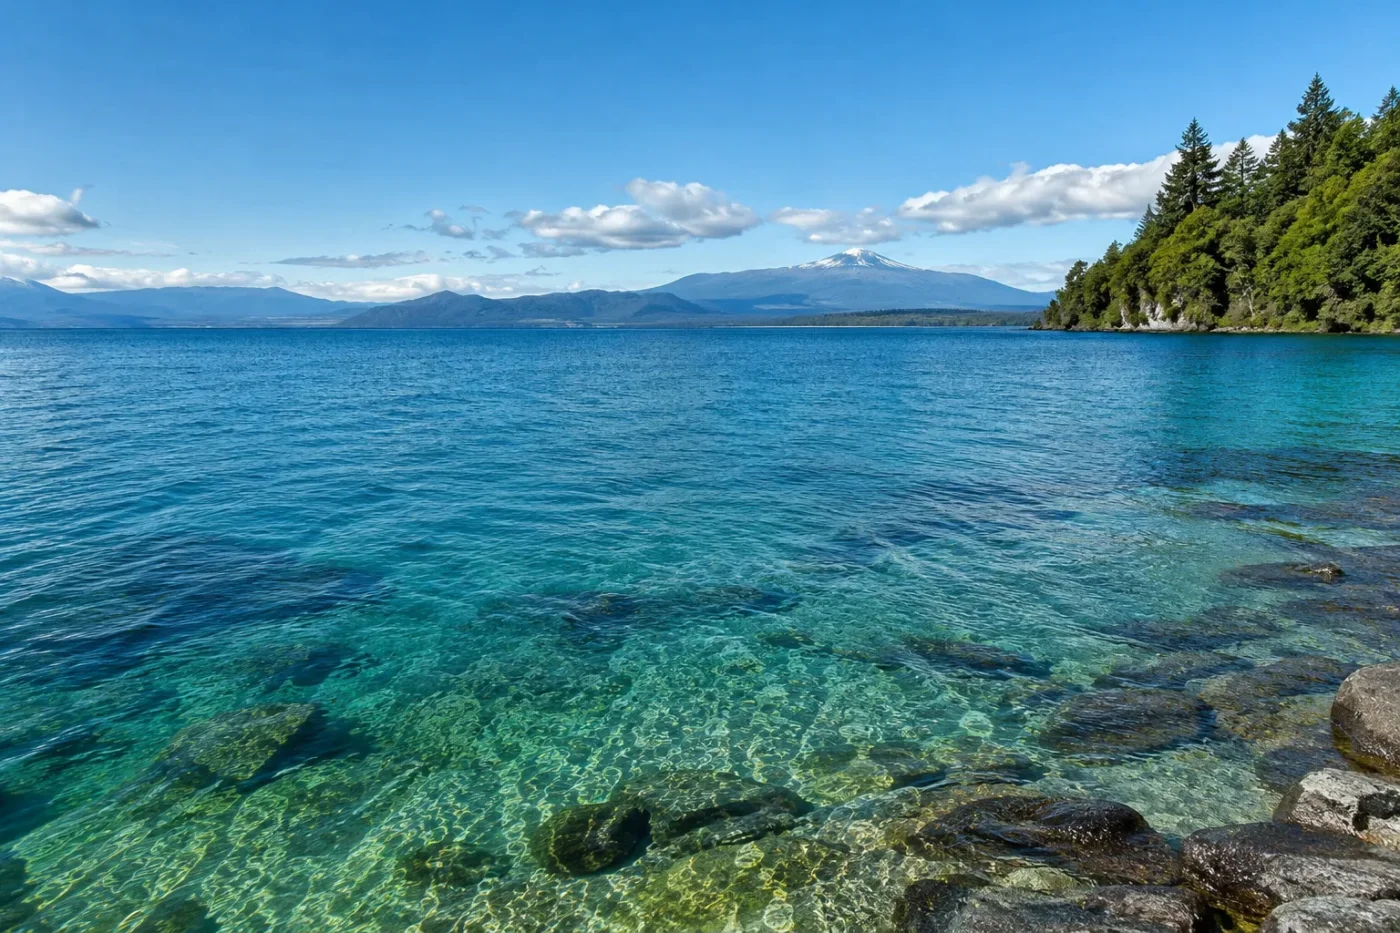
Department of Conservation — Directory of Wetlands in New ZealandOpenStreetMap — Lake Taupō relation 1130806Evidence: ModerateLake Taupō’s normal open-water appearance is clear blue-green to blue, not opaque green. Optical work by NIWA found that most light leaving the lake falls in the 450–550 nm range, while regional monitoring links the high clarity to its oligotrophic, low-algae condition. The volcanic caldera gives Taupō its great depth, but suspended volcanic minerals are not the main explanation for the color.
Taupō’s blue-green band is visible in the spectrum
The lake’s color comes from selective absorption and scattering rather than a single dissolved pigment. Water itself removes long red wavelengths efficiently. Colored dissolved organic matter absorbs more strongly at the short-wavelength end, while phytoplankton and other particles add absorption and scattering. With relatively little material suspended in the water, a broad blue-green band survives strongly enough to dominate the light returning to an observer.
During the May 2002 TAUPEX optical experiment, the measured absorption budget was split among four components. Those percentages describe the conditions during that study period, not a permanent formula for every day of every year.
| Optical component | Share of absorption | What it does to the spectrum |
|---|---|---|
| Water | 47% | Removes red and other long wavelengths strongly. |
| Colored dissolved organic matter | 28% | Absorbs more strongly toward the blue end. |
| Phytoplankton | 15% | Adds pigment absorption and particle scattering. |
| Other suspended material | 10% | Adds a smaller optical contribution under the measured conditions. |
A later peer-reviewed spectral study measured maximum reflectance at 490 nm and minimum diffuse attenuation at 500 nm. Those are optical measurements, not a conversion to a precise paint color. They do, however, place Taupō’s strongest reflected light squarely in the blue-to-blue-green part of the visible spectrum.
The caldera sets the depth; it does not dye the lake with volcanic minerals
Lake Taupō occupies a deep volcanic basin. Recent lake-process research describes a mean depth of about 94 m and a maximum near 160 m, with steep inshore bathymetry around much of the lake. That geometry matters to appearance because a longer underwater light path strips out orange-red wavelengths quickly. NIWA’s underwater spectra showed that light at depth remains predominantly blue-green.
During TAUPEX, scattering was closely linked to algal particle abundance, while mineral particles made very little contribution. Taupō is therefore different from glacier-fed turquoise lakes whose color is dominated by suspended rock flour.
Depth also helps explain why the same lake can look dark blue offshore and greener or lighter near a shallow margin without requiring a different chemical state. Deep water removes more of the returning light, while shallow areas allow the bottom, submerged vegetation and shoreline substrate to influence what reaches the eye. That is an apparent color contrast layered on top of the lake’s measured blue-green optical identity.
Clarity reaches tens of metres, but the center and bays do not behave identically
TAUPEX measured the depth at which only 1% of surface light remained at about 26 m in bays and almost 45 m in the lake center. Secchi visibility during the same experiment ranged from 12 to 20 m, again with the center clearest. The two measurements are related but not interchangeable: Secchi depth records visual disappearance of a disc, while the 1% light depth tracks underwater irradiance.
Long-term Waikato Regional Council monitoring gives a broader reference point. For 2015–2019, the open-water site averaged 15 m Secchi depth, chlorophyll a averaged 1.0 mg/m³, total phosphorus 4.9 mg/m³ and total nitrogen 87 mg/m³. The low algal biomass is part of why the water remains clear enough for the blue portion of the spectrum to remain visually prominent.
Winter mixing raises phytoplankton without turning every winter month a new color
Lake Taupō is monomictic: it generally develops a long stratified phase and mixes deeply during winter. A 2025 peer-reviewed study describes winter mixing from roughly July to September, with phytoplankton biomass and production typically peaking around August. During the stratified period, commonly from September or October through late June, surface-water phytoplankton abundance and production decline as nitrate becomes depleted in the upper layer and accumulates deeper in the lake.
Waikato Regional Council’s monthly monitoring shows the same broad pattern, with chlorophyll peaks in winter. More algae can reduce clarity, but the size of that optical effect depends on algal type and other dissolved material. A winter chlorophyll maximum therefore should not be translated automatically into a fixed green color for June, July or August.
The annual calendar can map mixing, stratification and the winter phytoplankton maximum with confidence, but the available sources do not provide a measured visible color name for every month. The dominant blue-green identity and the seasonal biological cycle are related without being identical datasets.
A greener Taupō was modeled as an algae response, not observed as the normal state
NIWA used the TAUPEX measurements to test how the optical system could respond if algal concentrations rose. In the model, doubling algal growth reduced predicted water clarity by about 17% and shifted the dominant color toward green at about 540 nm. Modeled light at 10 m depth also fell by nearly 20%.
The 540 nm greener state is a scenario from the optical model. It shows the direction in which higher algal biomass could move Taupō’s appearance; it should not be presented as a current lake-wide color measurement or as a dated forecast.
This sensitivity is why clarity, chlorophyll and nutrients are more informative than photographs alone. A photograph can change with cloud cover, viewing angle, reflections and shoreline depth. Long-term color change requires evidence that the water’s optical constituents have changed, especially phytoplankton, dissolved organic matter or suspended material.
Sources
- Earth Sciences New Zealand / NIWA — Lake Taupo: clean and blue-green
- Water Resources Research — Relationships between spectral optical properties and optically active substances in a clear oligotrophic lake
- Waikato Regional Council — Lake Taupō’s water quality
- Ecosystems — Hypolimnetic Nutrient Subsidies to Surface Waters of a Large Lake
- Department of Conservation — A Directory of Wetlands in New Zealand: Tongariro/Taupo Conservancy
- OpenStreetMap — Lake Taupō relation 1130806